Author STWOBODAAT
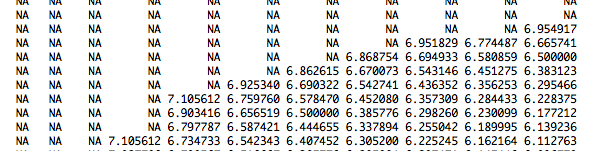
If you print things in R it probably hasn’t escaped your attention that print() is capable playing many roles. > print(“some text”) [1] “some text” > print(my_data_frame) a b c 1 1 red a 2 2 blue bcb 3 3… Continue Reading →
Danny Baker’s Sausage Sandwich game is often a great radio platform for exercising your statistical intuition in real-time. If you know it, Danny asks as celebrity sportsperson three fairly trivial questions about fairly inconsequential aspects of their day-to-day lives, and… Continue Reading →


So I’ve enrolled in an evening class, called Graphic Design Essentials. They give us homework and everything! What’s that all about? Anyway, week one was to create an “identity” – to find a brand and design it. As part of… Continue Reading →
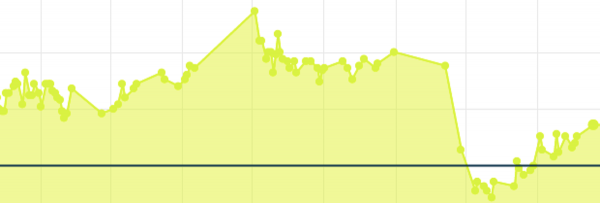
A look at my personal exercise and weight data for 2017 – according to the online services from Strava and Garmin
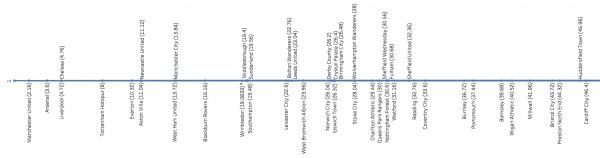
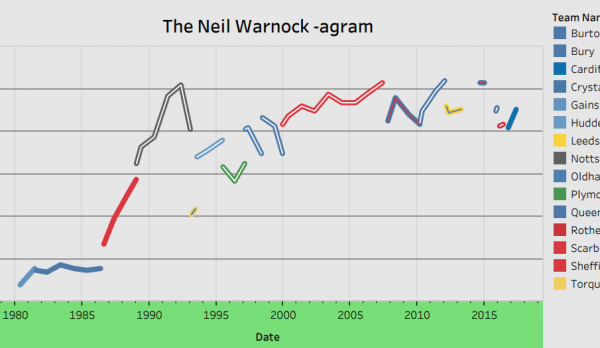
Plotting the average league position of every team in English league football for the last 25 years
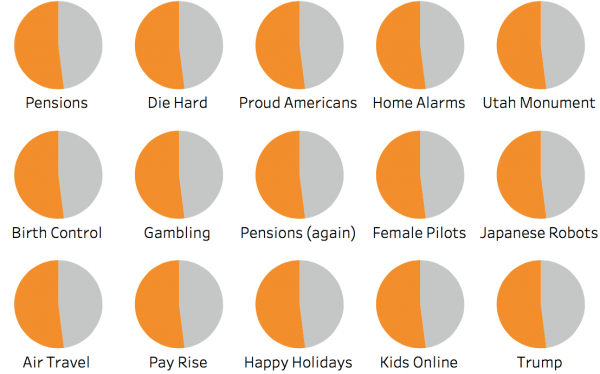
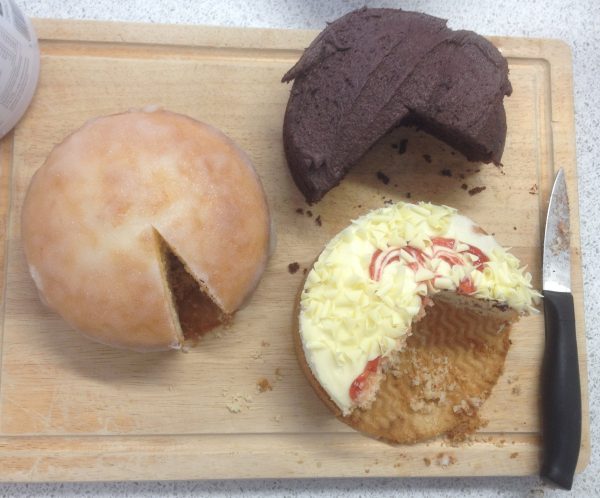
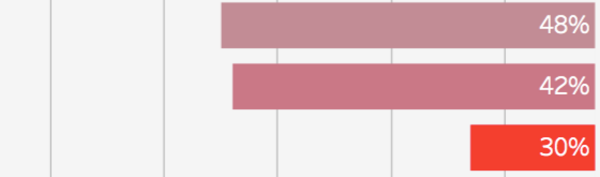
Polls with a 52% versus 48% split seem to be cropping up rather a lot lately. Here’s an array of pie charts containing 52% statistics
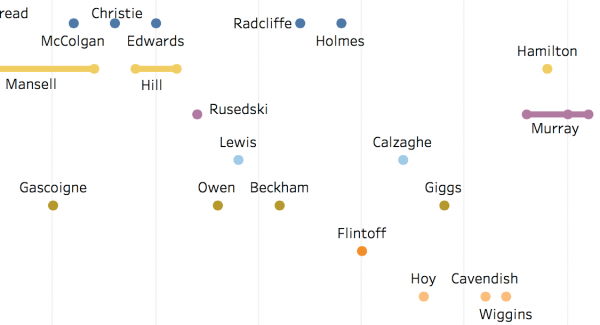
Today is BBC Sports Personality of the Year day – so what better time is there to produce a chart which’ll be out of date by the end of the day…

Charting salmon and sea trout data at the Environment Agency fish counter at Riding Mill, River Tyne. Because fish…

The first of a semi-regular feature where I look for an “interesting” dataset from the narrowest and least interesting source. What can possibly go wrong..?
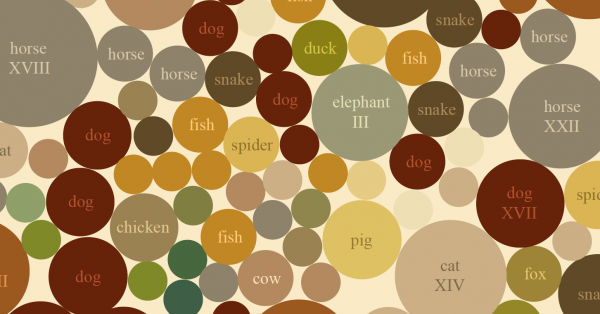
Are there really dinosaurs in Adventures of Huckleberry Finn?