It’s been a little quiet at STWOBODAAT lately, as I’ve been building this little database of English football history in my spare time.
It’s still early doors, but once it’s fully up and running I hope to put together loads of exciting visualizations.
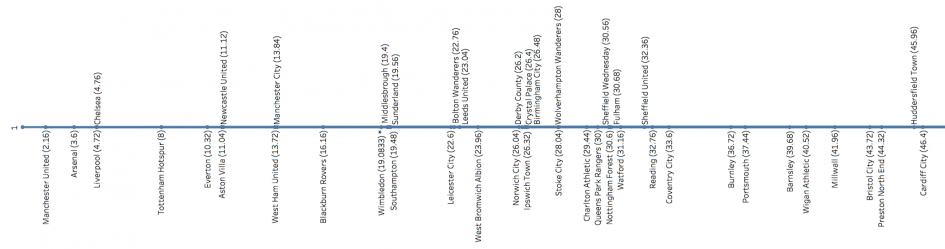
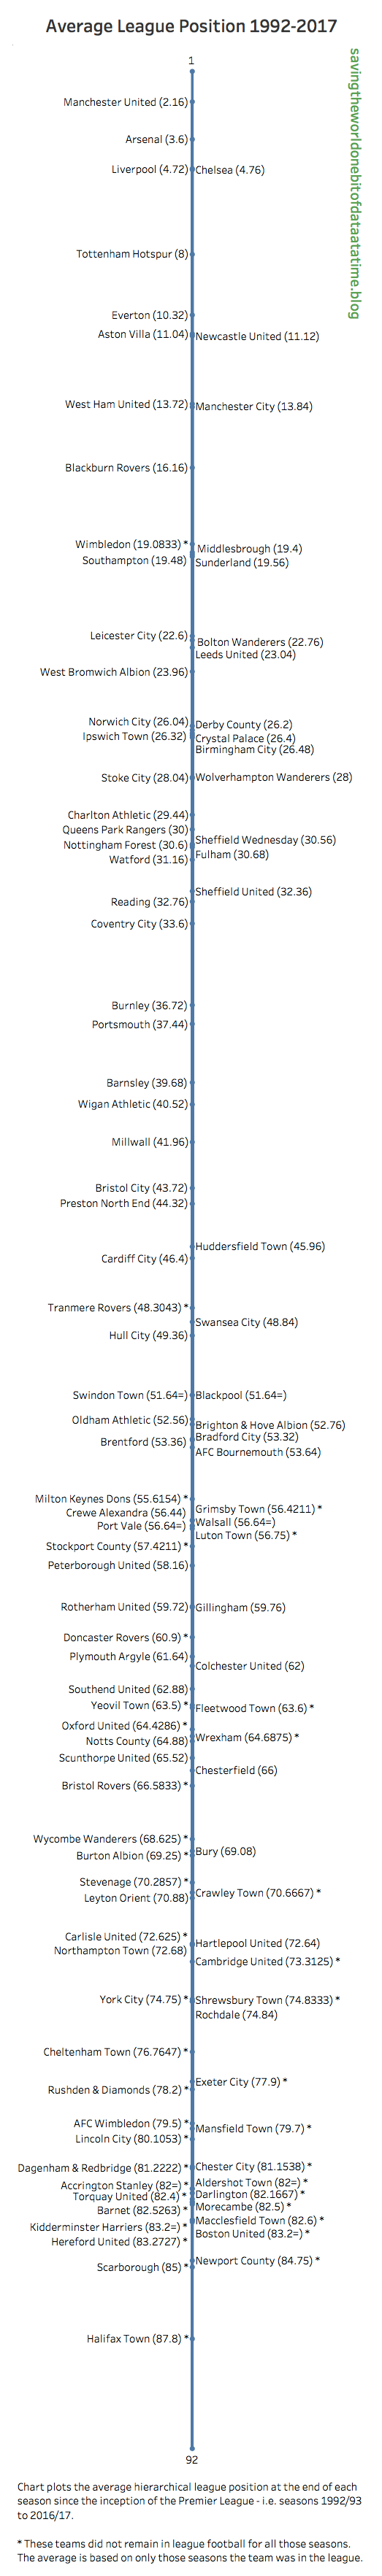
Here’s the first. It’s working out the average finishing position in the league for each team during the last 25 years (i.e. the Premier League era).
So for example, Manchester United finished: 1st, 1st, 2nd, 1st, 1st, 2nd… 4th, 5th, 6th – and the average of all those works out at 2.16.
For every season I’ve taken all positions from 1 to 92, chucked them all into the calculations and come up with this:
The original version is at Tableau.
Analysis
There are some interesting numbers in that lot:
- Only 15 teams have an average position putting them in the Premier League (top 20 or so). Statistically that probably makes sense.
- One of those is Wimbledon FC – whose final decline and disappearance was so sudden as to not affect the average too much.
- Then there’s a large cluster of all the teams you might expect to generally occupy the upper echelons of the second tier (The Championship in current parlance).
- Of all the teams ever in the Premier League, some of their average positions are still really low down this ladder. AFC Bournemouth is the lowest of these – at 53.64
It’s one of those charts that really simple, but the more you look the more you find. Enjoy!
Leave a Reply