Category random
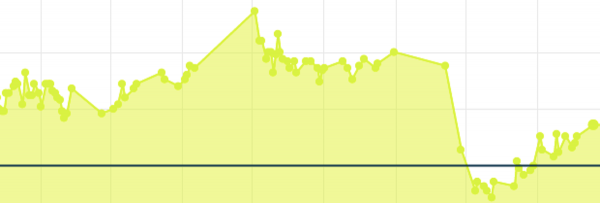
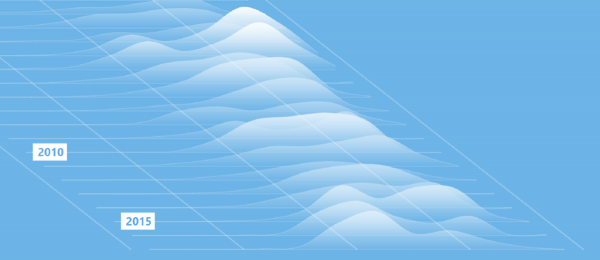
A look at my personal exercise and weight data for 2017 – according to the online services from Strava and Garmin
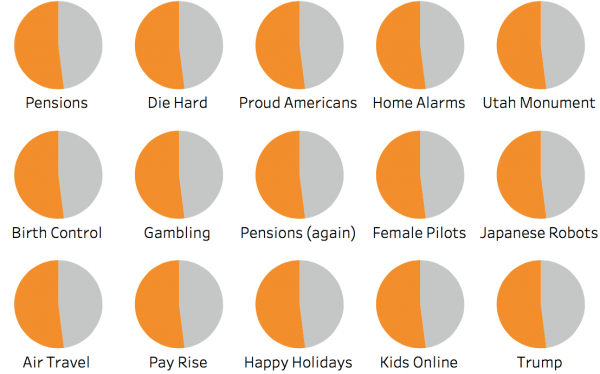
Polls with a 52% versus 48% split seem to be cropping up rather a lot lately. Here’s an array of pie charts containing 52% statistics
Charting salmon and sea trout data at the Environment Agency fish counter at Riding Mill, River Tyne. Because fish…
The first of a semi-regular feature where I look for an “interesting” dataset from the narrowest and least interesting source. What can possibly go wrong..?
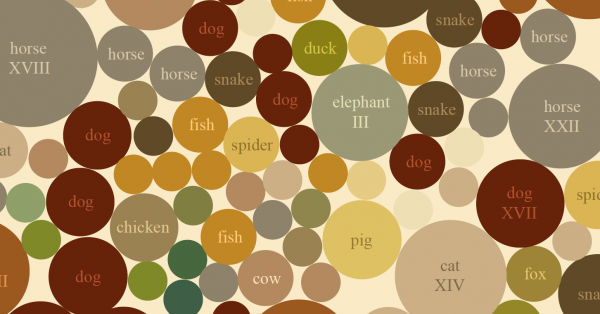
Are there really dinosaurs in Adventures of Huckleberry Finn?