This is clearly a brazen attempt to gain site traffic from Google every time someone asks “how many times does Mark Twain mention the word tyrannosaurus in The Adventures of Huckleberry Finn?”
And perhaps when the Annals of Pointless Number Crunching does eventually get published, I’ll get an honourable mention in the appendix out of this? (hint!)
So what exactly is this?
It’s a graphic representing the count of the number of times the names of various animals are mentioned in each chapter of said book. A pig, for example, first appears in chapter VII. It does not end well for the pig…
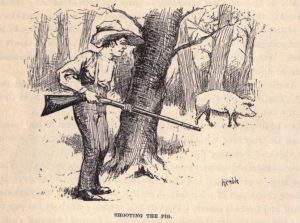
spoiler: the pig dies
There was a reason for sourcing these numbers, honest. I needed some silly real-world (hmmm..) numbers for a presentation I was doing on data warehousing, and to demonstrate the power of a reporting schema. It’s was gonna be ace! No, really!!
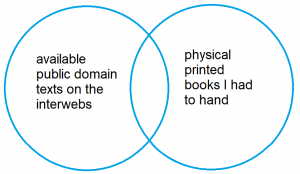
Why Huckleberry Finn? – simples, it fell in to the sweet spot represented by this venn diagram:
First, the data
The text (and kindle fill and various other resources) are freely available at archive.org, along with numerous other out-of-copyright publications. It’s an incredible resource.
I was going to write here about how I’d written some clever SQL to parse the text, word by word, and fully automate the counting of occurrences that way – but I’ve since realised this bit of work predates my creating that code for another project. Maybe I’ll write about that at a later date.
Instead it was the product of a rather simpler, and slightly less precise string search, based on my manual input of all the likely animal names I could think of – and some less likely ones (elephant, kangaroo, tyrannosaurus… only one of which, it turns out, doesn’t get a mention).
There were a few other animals I though likely to occur which also weren’t found in the book. To add to the suspense, the interactive Tableau Viz at the end of this tale includes the facility to search by all those animals I looked for, and all chapters – even though some animals don’t occur, and some chapters contain no animals. Exciting!!
The presentation
For the aforementioned presentation all I wanted was a table of results: word – chapter# – word count
I was going to get my stooge – it was going to be hilarious! – to count word occurrences of a randomly chosen animal from the printed book, whilst unbeknown to them the processed summary table was projected behind their back, so that somebody else could find the answer somewhat quicker.
But in the end, time was short and the fun bit of the presentation got dropped. Their loss!
In case you wondered, here are the occurrences I found, by total word count for the whole book:
animal & count

dog 58

horse 39

rat 36

snake 31

cat 21

fish 14

cow 11

spider 11

chicken 7

sheep 6

elephant 6

pig 5

rabbit 4

frog 4

goose 3

fox 3

duck 3

parrot 2

dove 2

squirrel 1

kangaroo 1

beaver 1

mouse 1

ox 1

skunk 1

deer 1

giraffe 0

eagle 0

marmot 0

tyrannosaurus 0

chipmunk 0

gopher 0

worm 0

alligator 0

toad 0
So now what?
But for this blog I wondered what else I could do with the data, since I’d gone to the effort and all…
First up, I though I’d give SSRS’s new treemap chart a go. It’s new in the 2016 version, and for various reasons that’s not a version I’ve made much use of in my day job.
So here that is. This represents at least, ooh 30 seconds of effort. It’s pretty much as it comes out of the box, SQL Server’s colour choice rather than mine. All I’ve changed is the size (for better image quality) and the font used (to make it a little more literary-looking).
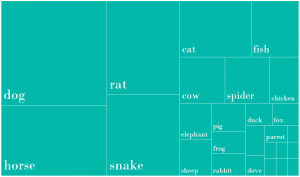
Pretty boring. To be honest I don’t think I’ve ever got the idea of treemaps. They use rectangular space really efficiently, I’ll give them that much, but otherwise I find them rather (ironically) one-dimensional…
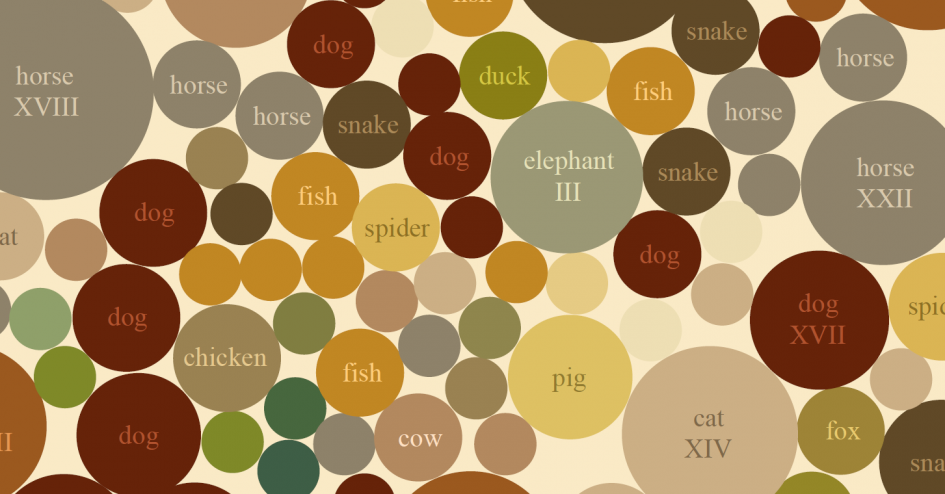
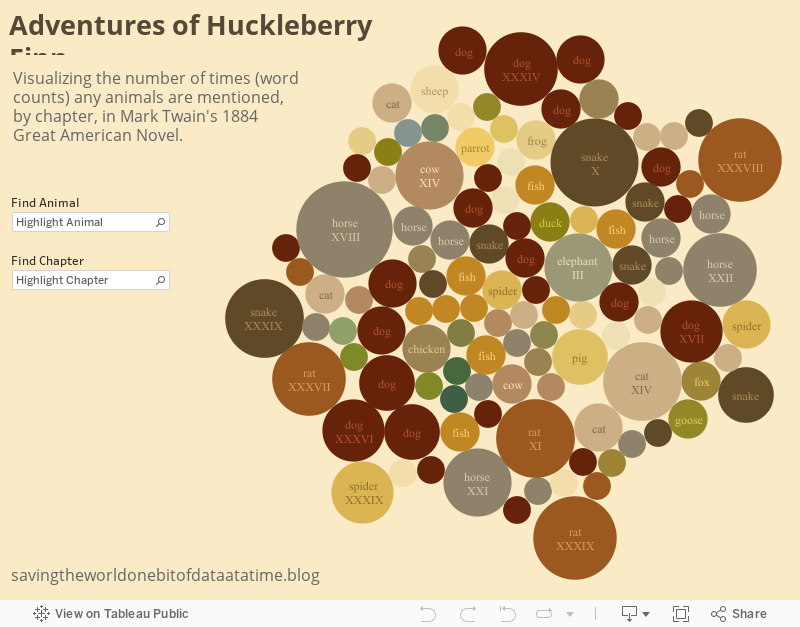
So we’ve tried squares, let’s try some circles instead. How about Tableau’s packed bubble chart.
This I really like! For such a mundane (and pointless) dataset, what came out of this is delightful. I’ve added an old-timey looking colour scheme from a page which was published in a book called Century of Color: Exterior Decoration for American Buildings: 1820-1920, by Dr. Robert Moss – published in 1981, but the page entitled Heritage Colors: 1820-1920 is handily reproduced quite widely on today’s www, include the link I posted there.
Full page version is here.
Note: If you really did find this page by Googling “how many times does Mark Twain mention the word tyrannosaurus in The Adventures of Huckleberry Finn?”, do let me know! The answer is given above.
Leave a Reply