Today is BBC Sports Personality of the Year day – so what better time is there to produce a chart which’ll be out of date by the end of the day…
I’m back in the game of learning to use Tableau, and to be honest it’s still all a bit frustrating.
I was reading a Tableau tutorial blog with the delightful title Eddie Van Halen and Dashed Lines, where Jonathan Drummey describes the following back-to-front approach to what he describes as “Tableau mastery”:
“
- Understand your goal.
- Understand your data.
- Figure out what the ideal data structure and values – given an understanding of how Tableau works – would look like to reach that goal.
- Then and only then figuring out what calculated fields, dimensions, measures, and/or reshaped data would lead back to #1.
- Build the view. Now you start dragging and dropping pills.
”
Which is absolutely the approach I use with the tools I’m familiar with. It’s the only way to do this kind of stuff!
Unfortunately, with Tableau I’m still in that early days approach which is more akin to:
- Understand my desired goal
- Understand my data
- Drag some things in to different areas of the Tableau interface and see what happens
- Try clicking things
- Google some more
- Take about 2 hours to work out how to hide different chart elements which I don’t want to see (involves lots of googling)
- Produce a lesser version of my original goal
And in about 90% of instances the outcome of step 8 is totally disappointing and ends up getting binned.
But that’s what learning is about. I will find the time to follow some proper step-by-step fundamentals tutorials eventually, and then I’ll be in a really good place for my Tableau skills to let loose…
In the mean time, here’s one of those 10%. Click the image to access the full-sized source Viz interactively at Tableau.com
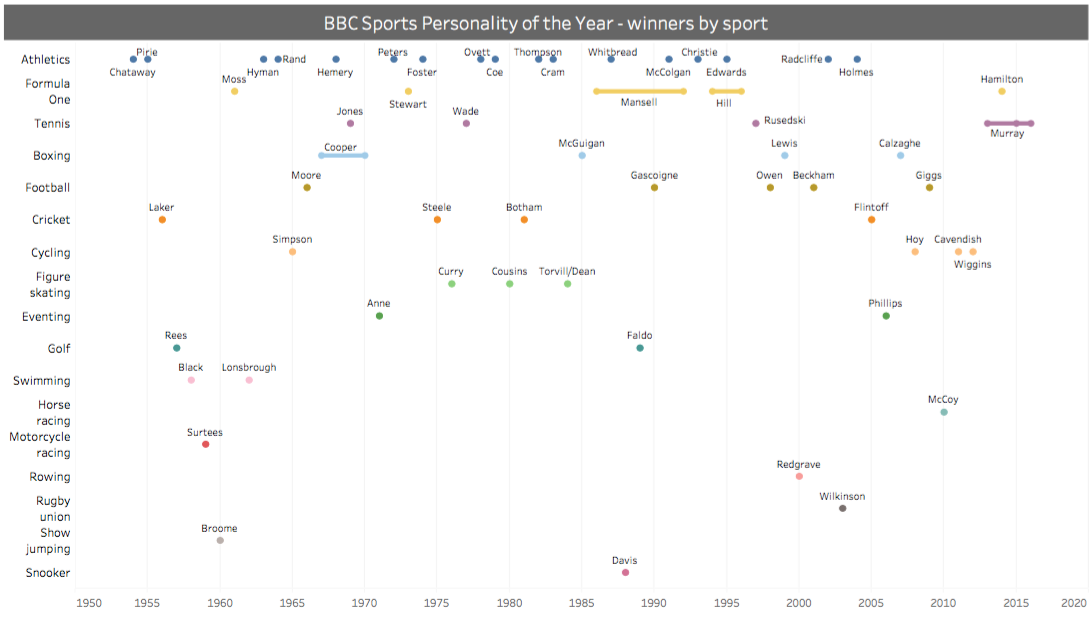
It tells a story and is really easy to understand and interpret. Which is always what you’re looking for. So it’s not what I had in mind in step 1 (maybe I’ll revisit in about 12 months’ time) but I kind of like it anyway. Enjoy.
Source data from Wikipedia.
Leave a Reply